Your Training Data Is Trying to Tell You Something. Are You Listening?
You pushed out training. You checked completion. Then what?
For most training leaders, the reporting conversation stops there. Completion hit 74%, great, moving on. But that number on its own doesn't tell you whether the training worked. It doesn't tell you whether team members can actually do the thing you trained them on. And it definitely doesn't tell you whether it moved any of the business outcomes you actually care about.
The teams that get the most out of their training data aren't looking at different numbers. They're asking different questions before they ever open a report.
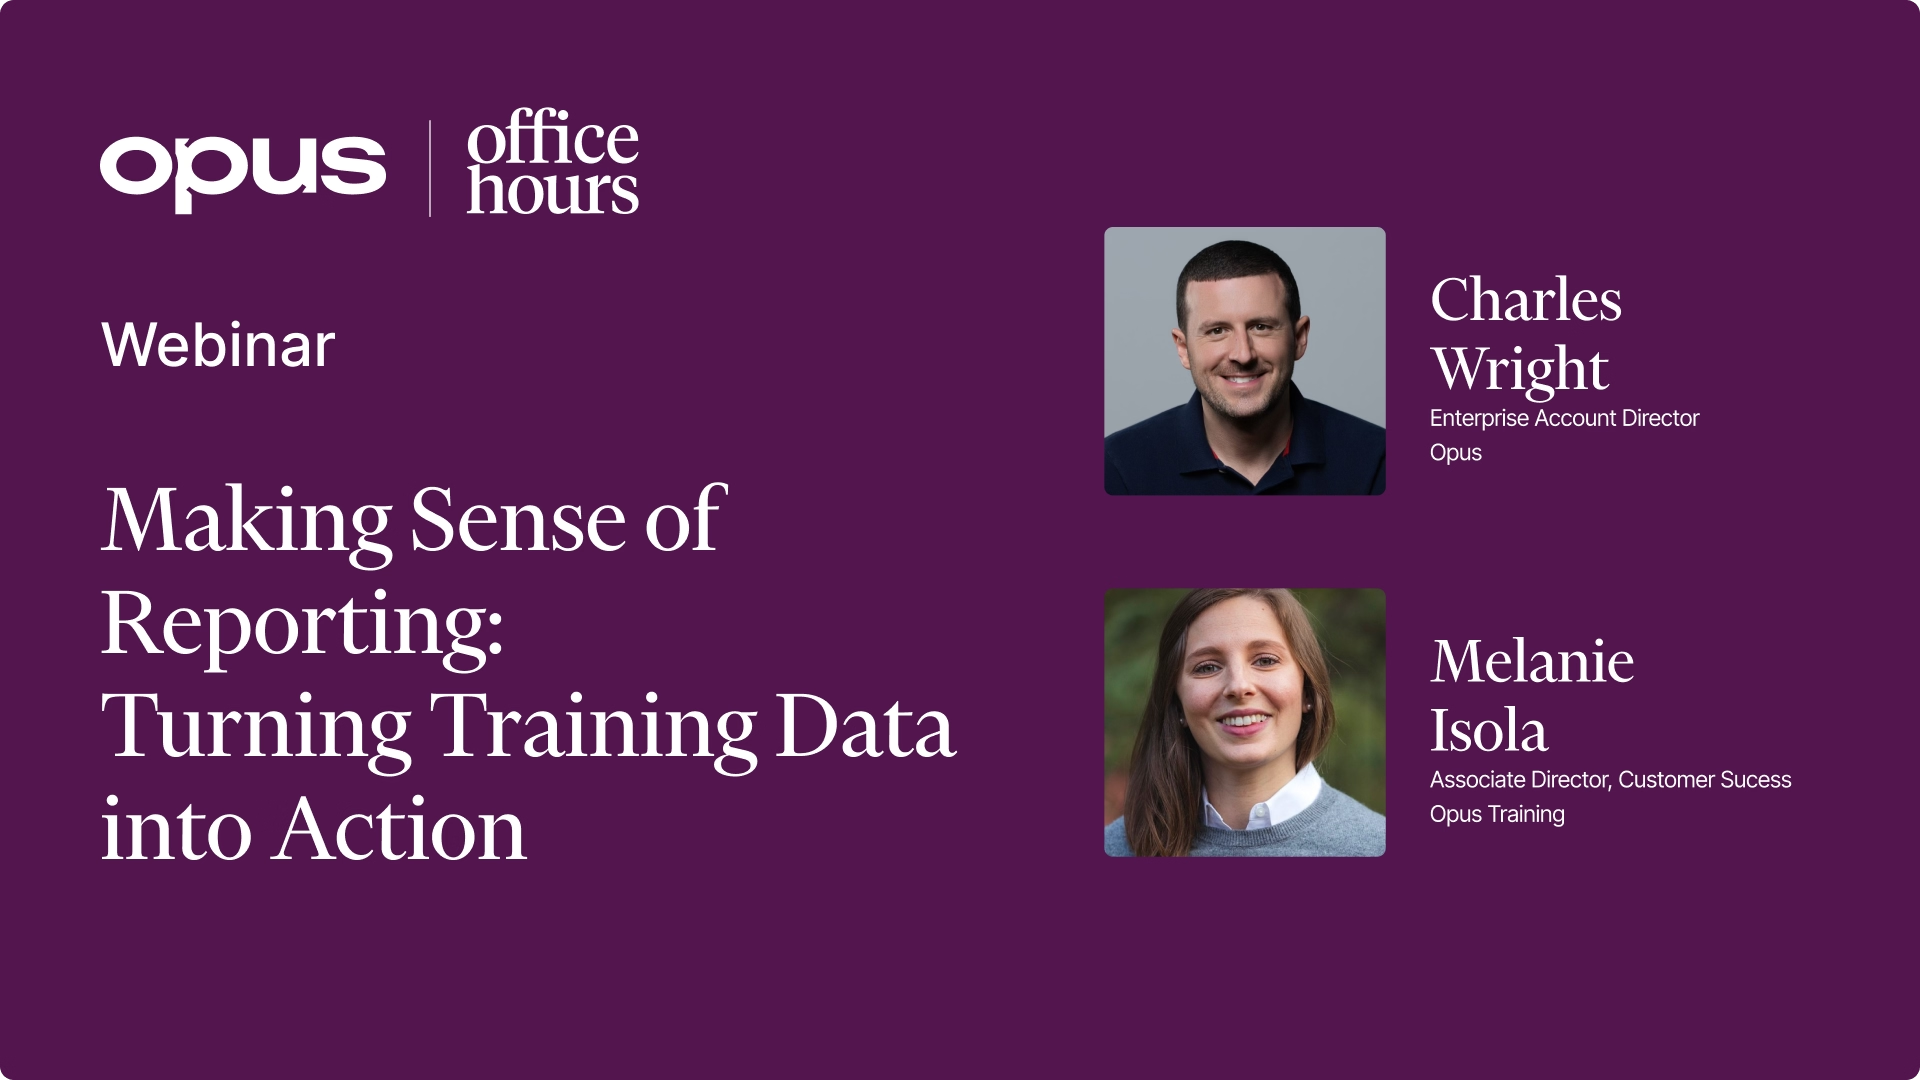
In our latest Office Hours session, Melanie Isola (Associate Director, CS) sat down with Charles Wright, (Enterprise Account Director at Opus and former training leader at Cunningham Restaurant Group), to dig into exactly that. Here's what they covered.
The Question You Need to Ask Before You Look at Any Data
Before you pull a single report, you need to answer one question: why did you do this training in the first place?
Not "because it was due" or "because corporate asked for it." What were you actually trying to change? What would success look like in the real world, not in the platform?
That question sounds simple. But most training leaders skip it, or answer it too vaguely, and then end up staring at completion data that doesn't tell them anything useful.
The goal you set upfront determines which data matters. And the right goal — and the right type of training — looks different for every business.
Take VASA Fitness. A gym runs on member retention. People renewing their memberships month after month because the experience they're getting is consistently excellent. For a fitness brand, training isn't about pushing paper. It's about making sure every coach, at every location, is delivering a class experience that makes members want to come back. This is role-based training — building the foundational skills and consistency that define the job. The business outcome is renewal rate. The training goal is consistency of delivery. The data question becomes: are team members actually doing the thing we trained them on, and is it showing up in the member experience?
Compare that to Super Star Car Wash, operating across 115+ locations in Arizona, California, Colorado, and Texas. Their business runs on membership conversions — turning single-wash customers into unlimited plan subscribers. Training around a new membership promotion is a different category entirely — just-in-time training, pushed out fast to prepare team members for something specific and time-sensitive. It's not about building a skill over time. It's about whether team members can confidently explain the value and make the ask at the point of service, right now. Completion tells you they went through the training. But the data questions that actually matter are: did the upsell conversation change — and did membership sales go up?
Two different types of training. Two completely different business outcomes. Two completely different questions to ask of your data. The why behind each one should shape everything — what you build, how you measure it, and what you do when the numbers don't look right.
This is the thing Melanie and Charles kept coming back to throughout the session: the metric you should be tracking is determined by the outcome you're trying to reach. If you don't define that first, you end up defaulting to completion because it's available — not because it answers anything.
What Are You Actually Trying to Change? (A Simple Framework)
Once you know your training goal, the right metrics follow naturally. Here's how to think through it:
If the goal is awareness — team members need to know something exists (a new menu item, an upcoming promo, a policy change) — then completion data is probably enough. They went through it, they know. Check. But this only holds if your adoption numbers are solid. If a meaningful chunk of your team isn't in the platform, completion rates will overstate how many people actually got the message.
If the goal is knowledge — team members need to understand how something works well enough to explain it or apply it — look at completion and accuracy. Are they getting the knowledge check questions right? On the first try, or only after multiple attempts? That tells you whether it actually landed.
If the goal is behavior change — team members need to do something differently on the floor — completion and accuracy alone won't cut it. You need to connect training data to something in the real world: observational check-ins, audit scores, before-and-after sales data, guest feedback. This is where leading indicators (your training data) connect to lagging outcomes (the business result).
Charles anchored this to his experience running LTO training at Cunningham Restaurant Group:
"If it's just awareness, maybe you're looking at strictly completion, and that works for you. But if you want to know if they're actually featuring the item to guests — that's when you need something else."
— Charles Wright, Enterprise Account Director, Opus Training
The point isn't to always do more. It's to match what you're tracking to what you actually need to know.
Know What You're Looking At: Reports vs. Dashboards
Before going further, it helps to get aligned on terminology — because teams often mean different things when they say "reporting."
- A report is a snapshot in time. You pull it, name it, save it. That's your benchmark.
- A dashboard is constantly moving. It reflects what's happening right now — in Opus, that's your last 30 days (D30).
Both are useful. But they answer different questions.
If you want to track completion month-over-month or quarter-over-quarter, the dashboard won't do that for you — it doesn't hold history. That's where static reports come in. Pull them regularly, name them consistently (think: "MayLTO_completion" or "Q2_newHire_accuracy"), and you can track trends over time even without a built-in comparison view.
The Three Metrics That Build on Each Other
When Charles was leading training at CRG, his team focused on three numbers:
1. Adoption — Is everyone actually in the platform? At CRG, they maintained around 95% adoption through an HRIS integration. That one fact changed how they could use their other data. The question adoption answers: can I trust my completion numbers? If 20% of your team isn't in the platform, your 80% completion rate is actually much lower. Fix adoption first.
2. Engagement — Are people using the platform beyond assigned training? Are they searching the resource library, using Ask Opus, going back to courses on their own? Engagement answers: is training becoming a habit, or just a checkbox? High engagement signals the platform is genuinely useful to your team. Low engagement is a signal worth investigating before you draw conclusions from completion.
3. Completion — With adoption and engagement healthy, completion becomes a reliable indicator. The question completion answers depends entirely on what you're tracking it against — which brings you back to the goal you set at the start.
These three aren't interchangeable. You can't skip adoption and trust completion. You can't ignore engagement and understand why completion is low. They build on each other.
Drill Down. The Org-Wide Number Never Tells the Full Story.
A 73% completion rate across your organization might look fine — until you break it down by location.
That's where the real information lives. As Charles put it: your organization-wide number doesn't tell the whole story. You have locations beneath that struggling for reasons that look very different from each other.
When you spot a location lagging, the next question is: is this a data problem or an ops problem?
Data problem: Are team members assigned correctly in the platform? Has there been turnover on the training champion role? Is there a technical issue getting in the way? Sometimes low numbers aren't about training at all.
Ops problem: Are there competing priorities — a leadership change, a seasonal surge, an understaffed stretch? Charles was direct about this: "We have initiatives constantly overlapping. Competing priorities, all the time." When training numbers dip, ops context is often the explanation.
This is also why cross-functional relationships matter. The data surfaces the signal. Your ops partners help you interpret it. Charles built his practice around that partnership: "It's about building a relationship with those other stakeholders, landing on something that works. Ultimately, it has to work for the trainees."
Meeting Your Teams Where They Are
Not everyone will log into a dashboard to check reports. Charles was candid: when he was a training leader, custom reports sent directly to inboxes often moved the needle more than anything in the platform.
"There is something about a report that hits an email inbox once a week that seemed to help a lot. They could print it out and put it right next to the POS."
The goal isn't to force people into a new workflow — it's to get the right information into the right hands in a format they'll actually use. That means asking your ops partners directly: what do you need to see, and how do you need to receive it, to actually act on it?
100% Accuracy Might Be a Red Flag
This one surprised the room.
Melanie challenged Charles on it during prep: if everyone is getting every question right on the first try, your questions might be too easy. That's not a win — it's a signal you're not actually testing knowledge.
Flip side: if the same questions are getting missed consistently across locations, the training content itself may need a rethink. Maybe the question is poorly written. Maybe the training didn't actually cover the material well enough.
Course accuracy is one of the most underused data points in training. It's not just a pass/fail metric — it's a feedback loop on the quality of your content. And it only becomes useful if you're going back in to look at it.
As Melanie put it: "Training is iterative. You've gotta test some stuff out, see what works, and keep coming back to the data."
The Biggest Takeaway: Build In Time to Look Back
When Melanie asked Charles what he'd do differently if he were still in restaurants, his answer was simple.
"Doing better retros on how these things go. We're all so busy that sometimes it's really, really hard to find the time to look at what happened, make changes, and iterate."
Training leaders who are always chasing the next launch never get to use their data. The ones who build in even a small amount of structured review time get better with every cycle. They start to see patterns — what completion rates typically look like for a well-received LTO versus one that didn't land. What accuracy scores look like when content is too easy versus appropriately challenging. What engagement looks like when team members actually find the platform useful.
That context is what lets you move from reactive to proactive. And it's what makes the case for training investment — not "we hit 80% completion" but "here's what we've learned, here's what we've changed, and here's what it's producing."
What Attendees Shared
One of the best moments came from Chaley Butler of Ryman Hospitality Properties, who talked about their shift from due-date-driven training to an evergreen model. She described how check-ins have become the tool that demonstrates training's value to operations: "Are you seeing a return on the investment in your time by doing these meaningful check-ins?"
And Robert dropped a note in the chat that stopped the conversation: "Our locations with the best Opus rates also have the lowest turnover, and consequently the strongest year-over-year sales growth."
That's the connection this whole session was building toward. Training data as a leading indicator of business outcomes — not a compliance checkbox. Completion doesn't prove it worked. But when you start with a clear goal, track the right metrics for that goal, and connect those metrics to what's actually happening in the business, the story starts to emerge.
Three Things to Try This Week
- Pick one recent training and write down what you were actually trying to change. Not the topic — the outcome. Then ask: is the data I looked at actually measuring that?
- Pull a static report today and name it. This is your benchmark. You'll need it when you want to compare.
- Check one course's accuracy data. Are scores suspiciously perfect? Or are the same questions getting missed at the same locations? That's your content giving you feedback.
Missed this session? Reach out to your CSM for a link to the recording.
Have a topic you'd like us to cover in a future Office Hours? Let your CSM know — we crowdsource our agenda based on what's most meaningful to you.

.jpeg)